
Page 36 - Executive Summary
P. 36
15
Region Total
Land use plan of Thailand %
North Central Northeast South (Rai)
1. Forest zone 69,755,770 20,767,972 25,375,895 19,185,843 135,085,480 42.12
1.1 Conservation forest zone 60,674,935 16,522,393 17,266,911 16,079,617 110,573,857 34.47
1.1.1 Protected forest zone 49,305,954 14,787,405 11,550,796 10,571,584 86,215,739 26.88
1.1.2 Forest rehabilitation zone 1,389,849 334,596 793,899 375,796 2,894,140 0.90
1.1.3 Conditional forest rehabilitation 9,979,132 1,430,392 4,922,217 5,132,238 21,463,979 6.69
zone
1.2 Economic forest zone 6,863,291 2,991,208 3,583,670 2,448,919 15,887,088 4.96
1.2.1 Preservation forest zone 3,241,537 813,116 812,464 846,289 5,713,406 1.78
1.2.2 Forest rehabilitation zone 313,923 73,173 341,029 60,781 788,906 0.25
1.2.3 Conditional forest rehabilitation 3,307,831 2,104,919 2,430,177 1,541,849 9,384,776 2.93
zone
1.3 Preservation forest zone by 2,217,544 1,224,371 4,525,313 657,306 8,624,534 2.69
cabinet resolution
2. Agricultural zone 31,161,087 31,560,552 69,364,893 21,097,995 153,184,527 47.77
2.1 Prime agricultural zone 9,091,922 14,844,733 10,241,219 8,469,684 42,647,558 13.30
2.1.1 Paddy zone 5,011,989 9,715,786 4,784,981 2,814,374 22,327,130 6.96
2.1.2 Field crop, orchard, perennial 4,074,748 5,128,947 3,483,042 5,003,790 17,690,527 5.52
plants
2.1.3 GI plants zone (approved by EU) 5,185 - 1,973,196 651,520 2,629,901 0.82
2.2 High potential agricultural land 17,699,488 12,646,643 34,313,018 8,534,799 73,193,948 22.83
2.2.1 Paddy zone 10,266,785 3,796,275 17,329,941 2,333,835 33,726,836 10.52
2.2. Field crop, orchard, perennial 7,432,703 8,850,368 16,983,077 6,200,964 39,467,112 12.31
plants
2.3 Low potential agricultural land 4,369,677 4,069,176 24,810,656 4,093,512 37,343,021 11.64
3. Community zone 3,194,438 4,671,228 4,688,727 1,681,708 14,236,101 4.44
4. Industrial zone 369,783 1,103,631 296,160 189,065 1,958,639 0.61
4.1 Existing industrial zone 185,318 735,979 195,353 74,197 1,190,847 0.37
4.2 Mining zone 184,465 367,652 100,807 114,868 767,792 0.24
5. Ratchaphatsadu land or Royal 990,556 4,846,437 1,328,846 1,073,760 8,239,599 2.57
property zone
6. Water resources zone 1,392,317 1,782,285 3,232,800 1,495,154 7,902,556 2.46
6.1 Water resources within forest
504,505 615,574 364,538 1,008,855 2,493,472 0.77
zone
6.1.1 Natural water reservoir 113,515 85,795 88,993 835,499 1,123,802 0.34
6.1.2 Man-made reservoir 390,990 529,779 275,545 173,356 1,369,760 0.43
6.2 Water resources out of forest
887,812 1,166,711 2,868,262 486,299 5,409,084 1.69
zone
6.2.1 Natural water reservoir 651,061 621,549 1,698,104 390,033 3,360,747 1.05
6.2.2 Man-made reservoir 236,751 545,162 1,170,158 96,266 2,048,337 0.64
7. Historical zone 79,654 2,167 8,170 - 89,991 0.03
8. Recreation and open space zone - - - - - -
Total 106,943,605 64,734,272 104,295,491 44,723,525 320,686,893 100.00
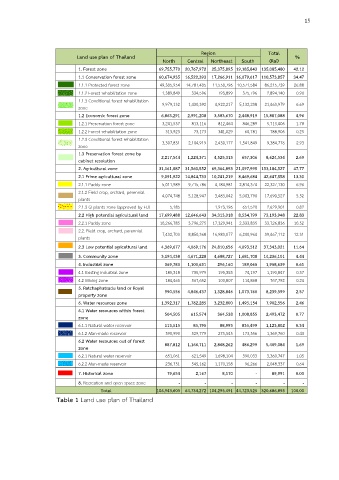
Table 1 Land use plan of Thailand